
Scans tab
The Scans tab is the project’s scan history. It lists every run, expands any one of them for full detail, and surfaces the per-agent activity log.
Scan history
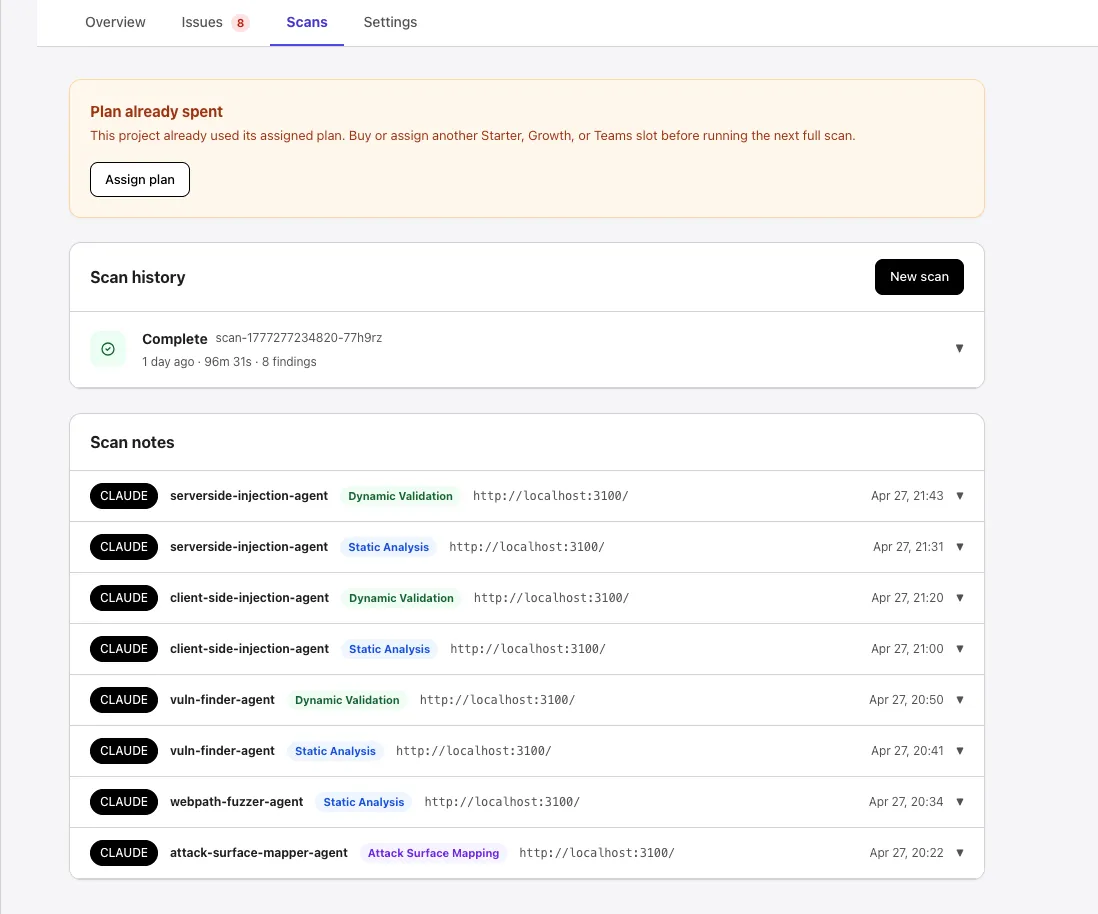
Section titled “Scan history”Each row in the Scan history list shows:
- A status icon (
Complete,Running,Error, etc.). - The scan ID (e.g.,
scan-1777277234820-77h9rz). - When the run started, how long it took, and the finding count (e.g., 1 day ago · 96m 31s · 8 findings).
A New scan button in the top-right starts another run.
Run detail
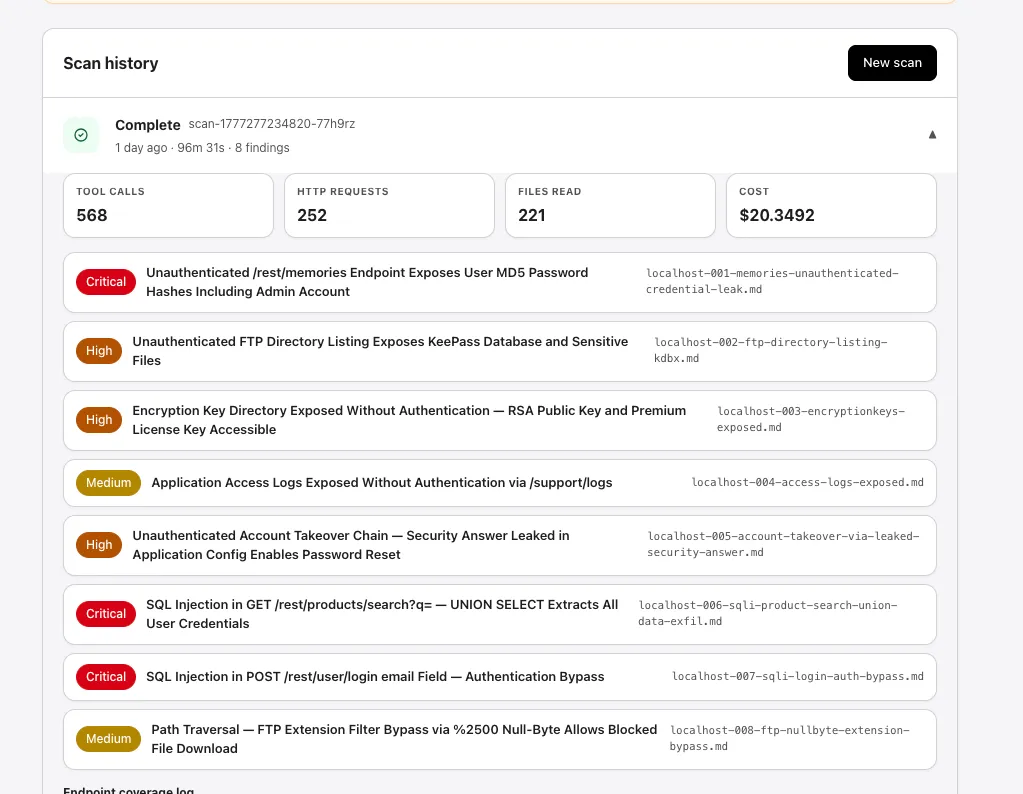
Section titled “Run detail”Selecting a row expands it inline. Each scan’s detail surfaces:
- Aggregate counters: Tool calls, HTTP requests, Files read, and Cost (USD).
- The findings list for that run, with severity badges, titles, and source filenames.
Endpoint coverage log
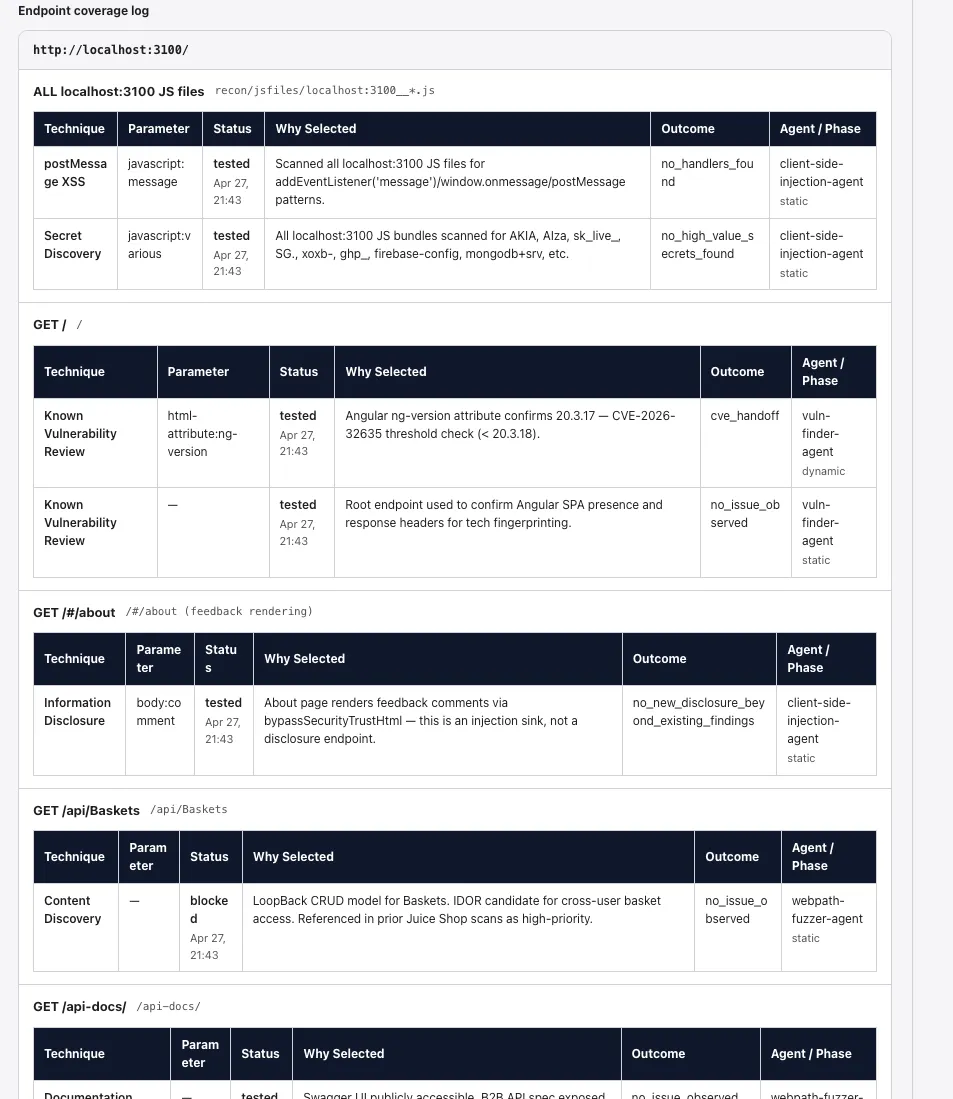
Section titled “Endpoint coverage log”Below the findings list, the endpoint coverage log shows what each agent tested at each URL: technique used (parameter injection, content discovery, etc.), parameter, status, outcome, and which agent ran the check. This is the audit trail behind the findings — useful when you need to confirm whether a specific endpoint was probed.
Scan notes
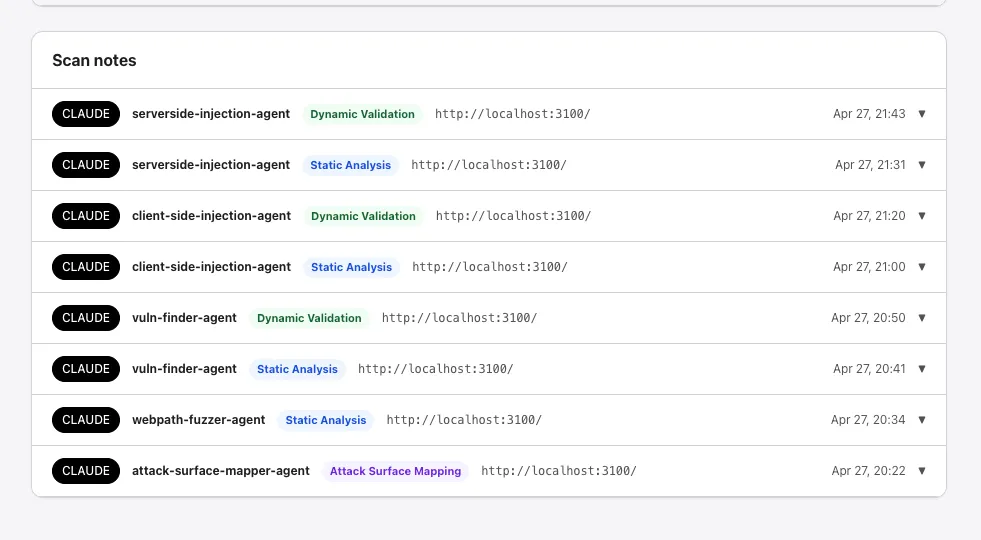
Section titled “Scan notes”The Scan notes card at the bottom of the tab is the per-agent activity log across runs. Each note row shows:
- The provider tag (e.g.,
CLAUDE). - The agent that produced it (
serverside-injection-agent,client-side-injection-agent,vuln-finder-agent,webpath-fuzzer-agent,attack-surface-mapper-agent, etc.). - The phase (
Dynamic Validation,Static Analysis,Attack Surface Mapping). - The URL the agent was working against and a timestamp.
Expand any row to read the full note.
For scan setup and configuration, see Configure and launch a scan.